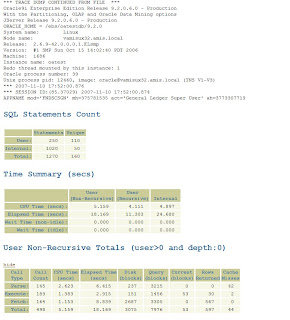
this tool could make my trace files easier to read.
You can download the tool from Metalink in zip format (trca.zip)
Install the tool...
unzip the trca.zip file
in the trca directory start a sqlplus session as sysdba...
[oracle@vamisux32 trca]$ sqlplus /nolog
SQL*Plus: Release 9.2.0.6.0 - Production on Sat Nov 10 17:02:08 2007
Copyright (c) 1982, 2002, Oracle Corporation. All rights reserved.
SQL> conn / as sysdba
Connected.
SQL> @install/tacusr.sql (askes for pwd and default tablespaces)
SQL> @tactab.sql
... Creating TRCA$_TRACE_ID Sequence
... Creating TRCA$... tables
NOTE:
TACTAB complete. Please check tactab.lis for any errors.
SQL> @tacpkg.sql
Taking a snapshot of DBA_EXTENTS (may take several minutes)
NOTE:
TACPKG complete. Please check tacpkg.lis for any errors.
Now the Trace Analyzer is installed in the EBS database.
I decided to create a trace file in EBS when querying journals in General ledger.

So, the trace file is created in the udump direcory. Lets see how it looks like
without analyzer....
*** TRACE DUMP CONTINUED FROM FILE ***
Oracle9i Enterprise Edition Release 9.2.0.6.0 - Production
With the Partitioning, OLAP and Oracle Data Mining options
JServer Release 9.2.0.6.0 - Production
ORACLE_HOME = /ebs/oatestdb/9.2.0
System name: Linux
Node name: vamisux32.amis.local
Release: 2.6.9-42.0.0.0.1.ELsmp
Version: #1 SMP Sun Oct 15 14:02:40 PDT 2006
Machine: i686
Instance name: oatest
Redo thread mounted by this instance: 1
Oracle process number: 39
Unix process pid: 12460, image: oracle@vamisux32.amis.local (TNS V1-V3)
*** 2007-11-10 17:52:00.876
*** SESSION ID:(85.37029) 2007-11-10 17:52:00.874
APPNAME mod='FNDSCSGN' mh=375781535 act='General Ledger Super User' ah=3773307719
=====================
PARSING IN CURSOR #65 len=70 dep=1 uid=47 oct=42 lid=47 tim=1166712422731428 hv=2110961874 ad='6746d1e4'
alter session set events='10046 trace name context forever, level 12'
END OF STMT
EXEC #65:c=2000,e=45848,p=0,cr=0,cu=0,mis=1,r=0,dep=1,og=4,tim=1166712422729192
WAIT #0: nam='SQL*Net message to client' ela= 9 p1=1952673792 p2=1 p3=0
WAIT #0: nam='SQL*Net message from client' ela= 1217 p1=1952673792 p2=1 p3=0
RPC CALL:FUNCTION APPS.FND_TRACE.GET_TRACE_FILENAME() RETURN VARCHAR2;
RPC BINDS:
bind 0: dty=1 bfp=0af28a20 flg=0a avl=00 mxl=32767 val=""
You see, the trace file looks like any other trace file. Difficult to read and also not easy to understand. When using the analyzer...
[oracle@vamisux32 trca]$ sqlplus apps/*****
SQL*Plus: Release 9.2.0.6.0 - Production on Sat Nov 10 18:01:52 2007
Copyright (c) 1982, 2002, Oracle Corporation. All rights reserved.
Connected to:
Oracle9i Enterprise Edition Release 9.2.0.6.0 - Production
With the Partitioning, OLAP and Oracle Data Mining options
JServer Release 9.2.0.6.0 - Production
SQL> start run/trcanlzr.sql oatest_ora_12460_SYSADMIN.trc
Value passed: oatest_ora_12460_SYSADMIN.trc
~~~~~~~~~~~~
...generating trcanlzr report into UDUMP server directory
Trace Analyzer Report "trcanlzr_12460_1.html" has been created in /ebs/oatestdb/9.2.0/admin/oatest_vamisux32/udump
...trcanlzr report has been generated into UDUMP server directory
...copying trcanlzr report into local SQL*Plus client directory
...trcanlzr report was copied from UDUMP into local SQL*Plus directory
When opening the html file, you see the difference....

3 comments:
Thanks. The steps here helped me make this work.
So what's hard to read in the original trace file? :+)
very very simple utility
not helped in big log files!!!!!!!!
Post a Comment